
US business formation statistics 2026
Americans filed 534,947 applications to start a business in September 2026. Below are 38 key statistics on US business formation: the latest month, yearly totals, records, milestones and the surge since 2020, each calculated from the Census Bureau's monthly series and linkable on its own.
Updated 31 October 2026. Source: U.S. Census Bureau, Business Formation Statistics. Monthly chart and full data: US business applications tracker. Look up any month or year since 2004: US business applications lookup. Download these figures: key figures (CSV) · by year (CSV).
Latest figures
- Americans filed 534,947 applications to start a business in September 2026, seasonally adjusted, the latest month published by the Census Bureau. #
- That is +0.5% from August 2026, when 532,051 applications were filed. #
- Compared with September 2025 (512,569), applications were +4.4%. #
- In the 12 months to September 2026, 6,260,300 business applications were filed, +15.0% on the previous 12 months. #
- That works out to about 17,152 applications a day. #
- The September 2026 figure is 82% above the 2019 monthly average of 293,134, the last full year before the pandemic. #
Applications by year
- From January to September 2026, 4,728,479 applications were filed, +15.2% on the same months of 2025. #
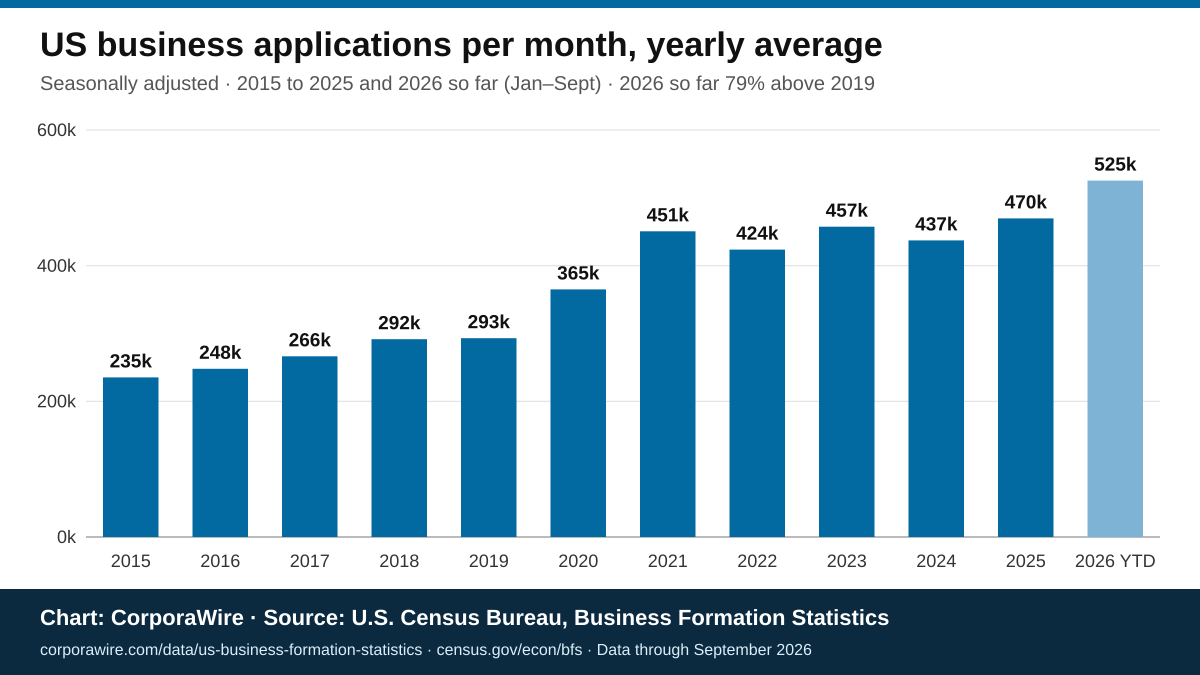
- The 2026 monthly average so far is 525,387. #
- 2025: 5,636,693 applications (469,724 a month), +7.4% on 2024. #
- 2024: 5,246,630 applications (437,219 a month), −4.4% on 2023. #
- 2023: 5,489,174 applications (457,431 a month), +8.0% on 2022. #
- 2022: 5,083,802 applications (423,650 a month), −6.0% on 2021. #
- 2021: 5,408,801 applications (450,733 a month), +23.5% on 2020. #
- 2020: 4,379,813 applications (364,984 a month), +24.5% on 2019. #
- 2019: 3,517,607 applications (293,134 a month), +0.5% on 2018. #
- 2018: 3,498,607 applications (291,551 a month), +9.4% on 2017. #
- 2017: 3,197,455 applications (266,455 a month), +7.4% on 2016. #
- 2016: 2,975,857 applications (247,988 a month), +5.4% on 2015. #
- 2015: 2,822,714 applications (235,226 a month), +5.9% on 2014. #
Records
- The highest monthly count since the series began in July 2004 is 576,264, in July 2026. #
- The lowest is 158,475, in July 2004. #
- The busiest complete year was 2025, with 5,636,693 applications. #
- The quietest complete year was 2009, with 2,428,403. #
- The largest one-month rise was +45.0% (169,793 more applications) in July 2020. #
- The largest one-month fall was −20.0% (55,044 fewer) in January 2013. #
Milestones
- Monthly applications first reached 300,000 in March 2019 (301,093). #
- Monthly applications first passed both 400,000 and 500,000 in July 2020, jumping to 546,719. #
- Monthly applications first reached 550,000 in July 2026 (576,264). #
- 72 of the 267 months on record have seen at least 400,000 applications, all of them since July 2020. #
- Applications have been above the 2019 monthly average for 77 months in a row, since May 2020. #
Pandemic surge and long-run change
- Applications rose 24.5% in 2020, to 4,379,813, despite the pandemic. #
- 2025 applications were 60.2% above 2019. #
- From January 2020 to September 2026, Americans filed 35,973,392 business applications in total. #
- 2005 to 2009: an average of 212,149 applications a month. #
- 2010 to 2014: an average of 215,363 applications a month. #
- 2015 to 2019: an average of 266,871 applications a month. #
- 2020 to 2024: an average of 426,804 applications a month. #
- The September 2026 count is 238% higher than the first month in the series, July 2004 (158,475). #
Download chart
A ready-to-use image of the average number of business applications filed each month in the US, year by year since 2015, with the current year so far alongside and the source credit printed on the chart. It is updated daily with this page and currently shows data through September 2026.
Download chart (PNG, 1200 × 675 px) · SVG version
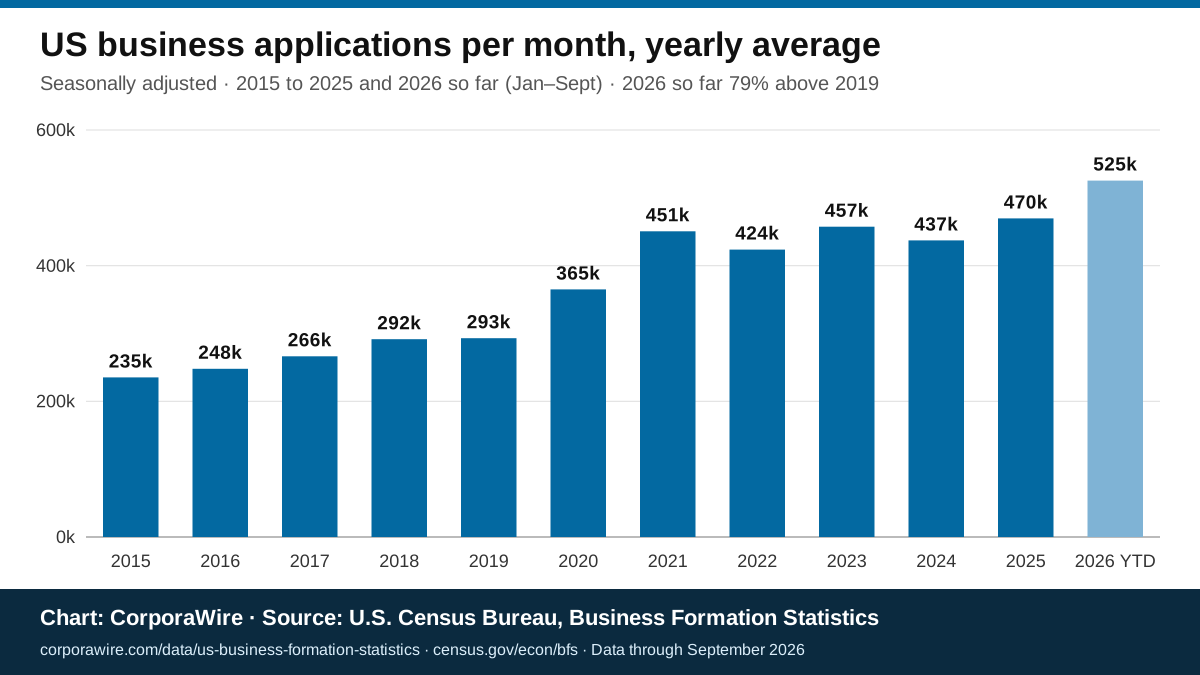
The underlying figures are U.S. Census Bureau Business Formation Statistics (seasonally adjusted monthly counts), averaged by calendar year by CorporaWire and rounded to the nearest thousand. The Census Bureau data are public U.S. government data. You may reuse the chart under CC BY 4.0 with credit to CorporaWire and a link to this page, keeping the source line "U.S. Census Bureau, Business Formation Statistics". Please keep the credit line on the image. To publish it, copy this code:
Download the data
The figures on this page are free to download as CSV files, built from the same Census Bureau data as the page and updated daily with it:
- US business formation key figures (CSV): all 38 statistics above, with the value, unit, period, full statement and a direct link to each figure.
- US business applications by year (CSV): the yearly total of seasonally adjusted applications, the monthly average, the change on the previous year and the busiest and quietest month for 2005 to 2025 (21 years).
The full monthly series since 2004 is on the US business applications tracker. You may reuse these files with credit to CorporaWire and the U.S. Census Bureau and a link to this page, under CC BY 4.0.
Cite this page
You are welcome to quote any statistic here with a link to this page. Each figure has its own link (the # after it) so you can point readers to the exact number, and a "Copy citation" button that copies the figure with its source and link.
Embed the latest business applications figure
Copy this HTML to show the headline figure on your own site or newsletter. It is plain HTML with no scripts. The number is fixed when you copy it, so copy it again after each monthly Census Bureau release. Please keep the credit link.
How these figures are calculated
All figures come from the Census Bureau's Business Formation Statistics series for total business applications in the United States, seasonally adjusted and monthly from July 2004, as published on FRED (series BABATOTALSAUS). An application is a request for an Employer Identification Number (EIN) from the IRS that is tied to starting a business; filings for estates, trusts and similar purposes are left out.
Yearly totals add up the twelve seasonally adjusted months of each complete calendar year, so they can differ slightly from the Census Bureau's unadjusted annual counts. Changes, averages, records and milestones are calculated by CorporaWire. Not every application becomes an operating business, and recent months can be revised. This page is refreshed daily from the latest release.